
To trade stocks on the stock market, it is necessary to thoroughly analyze various charts and make judgments based on trends and indicators. When it comes to market analysis, indicators are essential for all traders, whether beginners or seasoned professionals. Intraday indicators are enhancements to charts conveying critical information to traders through mathematical computations in their most basic form.
This post will cover the best indicators for intraday trading and how to benefit from your transactions by entering and leaving at the appropriate times.
Best Indicator for Intraday
It is a good intraday tip to stay on top of the market’s trend by paying attention to intraday indicators.
Volume
In the stock market, volume refers to the total number of shares acquired and sold in a given period. Volume is an excellent instrument for gauging the strength of a pattern breakout, gaps, etc. It can also serve as a confirmation indicator. You can also measure a stock’s liquidity by looking at its volume.
VWAP
Learn How to Use Volume Intraday Indicators
Best Indicator for Intraday. Most Effective Indicators
The next best intraday trading indicator is VWAP which stands for Volume Weighted Average Price. When trading intraday, investors must keep track of the stock volume they are selling. Volume Weighted Average Price is a volume indicator that measures the relationship between the value of stock exchanged at a specific time and the total volume transacted at that stock for a particular stock.
Moving Averages
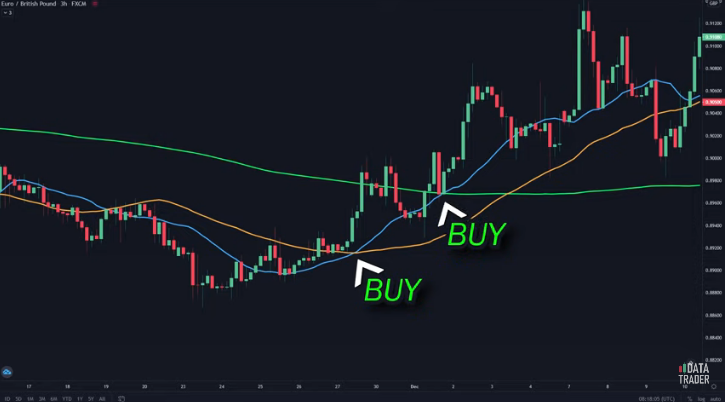
Moving averages are a popular intraday trading indicator that many traders employ. In addition to providing information on the market’s momentum, it also includes information about market trends, trend reversals, and the stop-loss and take-profit levels. The moving average is suitable for traders because it helps them figure out the market’s direction.
SuperTrend
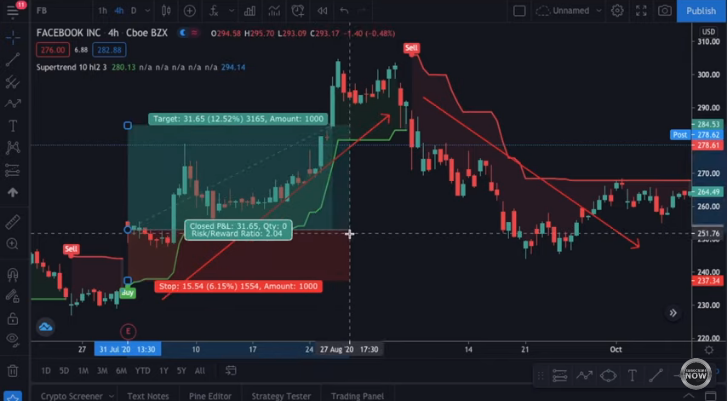
Traders can use the Supertrend indicator as a trading indicator for intraday trading. The indicator is on the price chart, and you may identify the recent trend simply by looking at where it is planned to the price. A straightforward indicator, the period and multiplier are the only two parameters that must be included when creating the indicator.
To do this, when constructing the Supertrend indicator, the default values of 10 for the Average True Range (ATR) are used and 3 for the multiplier. The actual average range plays a crucial part in the ‘Supertrend’ since it employs the ATR to compute its value and signal the extent of price volatility in its calculations.
Bollinger Bands Intraday Indicator
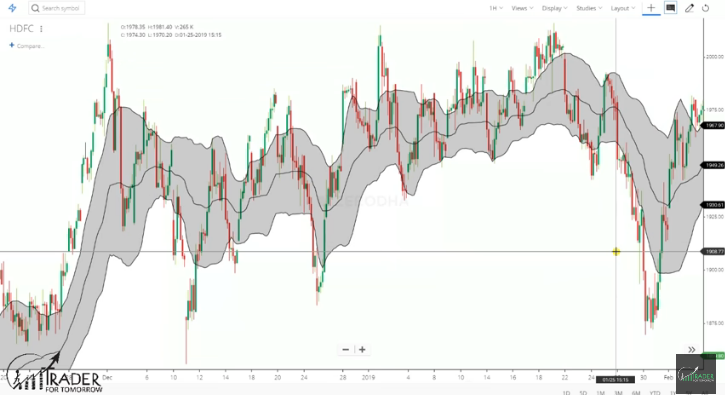
The Bollinger band comprises three conjunctures: the simple moving average, the upper, and the lower. In essence, both the upper and lower bands define 2-standard deviations +/-, supported by a 20-day simple moving average (middle band).
A common practice among traders during an uptrend is to sell their equities before the trend reverses. With an increase in selling activities among other sellers, traders are more likely to purchase equities while the market declines.
With the assistance of this ‘versatile instrument,’ the trader can clearly understand whether the product is overbought or oversold. The Bollinger band is, without a doubt, a well-known technical analysis tool that was established utilizing standard deviations and moving averages as analytical tools.
RSI (Relative Strength Index)
Relative Strength Index is the most accurate momentum indicator for intraday trading because it shows you the overbought and oversold sectors of a stock at any time. The RSI has two lines, one of which is 80 and the other is 20. Stocks are deemed to be in the overbought zone when the RSI exceeds 80, signaling that it is time to sell. When the RSI falls below 20, the stock is deemed in the oversold zone, indicating that it’s an excellent time to buy.
Moving Average Convergence Divergence (MACD)
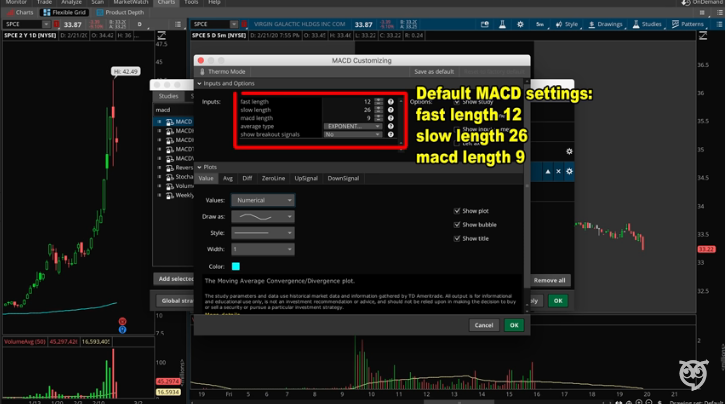
For intraday trading, momentum traders believe MACD to be one of the best and exemplary indicators available. This indicator gives information on a trending phenomenon’s direction, momentum, and length. The indicator is dependent on the convergence and divergence of two moving averages.
MACD suggests an upward trend, while a negative value implies a downward trend in the underlying market. It is suitable for tracking daily, weekly, and monthly price movements, but it isn’t particularly effective for day trading because the market is too volatile.
Stochastics
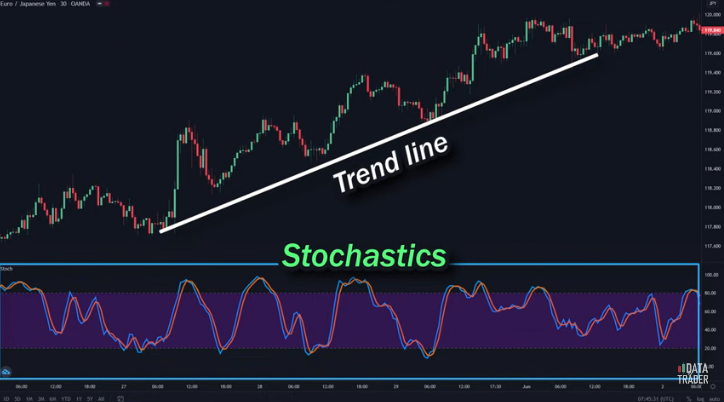
The stochastic oscillator is an indicator that has been around for a long time and is ideal for intraday and swing trading in the financial markets. When engaging in day trading, it is critical to consider the movement of the stock in which you are investing your money. George C. Lane invented the stochastic process in the 1950s.
To calculate the stochastic indicator, you can use the formula given below:
The three-day simple moving average of percent K is calculated as (present close – lowest low)/(highest high – lowest low)* 100 percent D.
The lowest low=the lowest point in time during the look-back period
Highest high=the highest high for the look-back period
The failure look-back time is 14 days, although this can be altered depending on the trader’s trading style. Also, intraday traders can operate shorter-period stochastics, while swing traders can use longer-period stochastics. Signals for trading are generated when the percent K line of the stochastic crosses the percent D line.
Conclusion
Best Intraday Indicators
Best Indicator for Intraday. Most Effective Indicators
Every short-term trader’s objective is to discern the direction of a particular asset’s momentum and seek to profit from that direction as soon as possible. There have been hundreds of technical indicators and oscillators explicitly built for this reason, and this article has presented a selection of a few best indicators for Intraday you may begin experimenting with immediately. You can either use the signs to design new methods or explore integrating them into your existing systems. You can use demo accounts to assess which ones are appropriate for use. Choose the best intraday indicator that appeals to you the most and discards the rest.