FINVIZ.com provides comprehensive information for analyzing the market of securities. Intraday, swing, momentum, technical traders, as well as long-term investors, can find this service very useful. The platform has two options of use – free and paid.
The free use of the service allows traders to get all necessary data about the financial market.
The paid option will enable users to watch additional fundamental charts, create portfolios, and track more information.
A crucial distinction of this trading service is that analytics is displayed with a delay of 20 minutes, which is not very convenient for intraday trading. It is also essential to note that the Finviz website provides analytical materials not only on the securities market, but also on indices, futures, and currencies.
The high popularity of this service among professional traders is explained by the variety of automatic filters built into the website’s functionality, using which it is possible to select the necessary assets for subsequent analysis.
FINVIZ.com – Stock Screener Main Sections
News

(Screenshot: https://finviz.com/news.ashx)
This is a handy section for getting fundamental analytics, as this section contains actual news from reputable agencies and financial analytical companies.
Screener
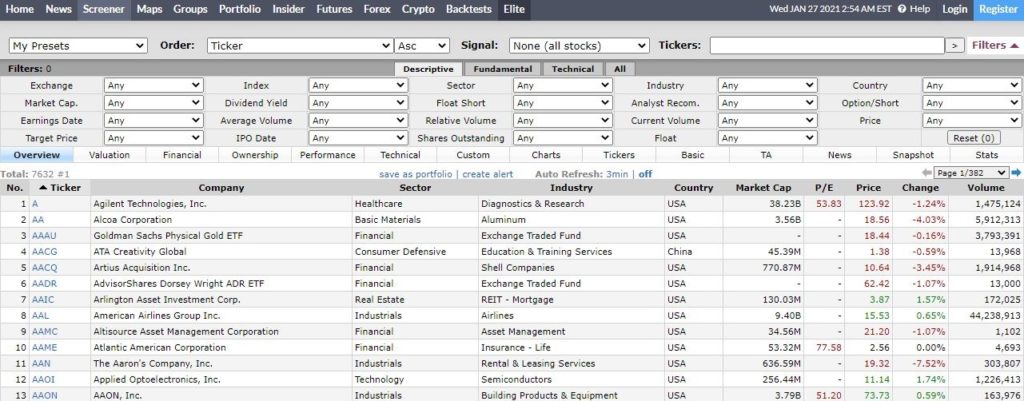
(Screenshot – https://finviz.com/screener.ashx)
This sector provides comprehensive information and tools for filtering stocks of more than 7,000 companies whose shares are traded on the most extensive stock trading floors. Thanks to features of the screener traders can carefully filter stocks. When working with a screener, it is vital to evaluate the quality of filters in accordance with the rules of the applied trading strategy.
Market Maps
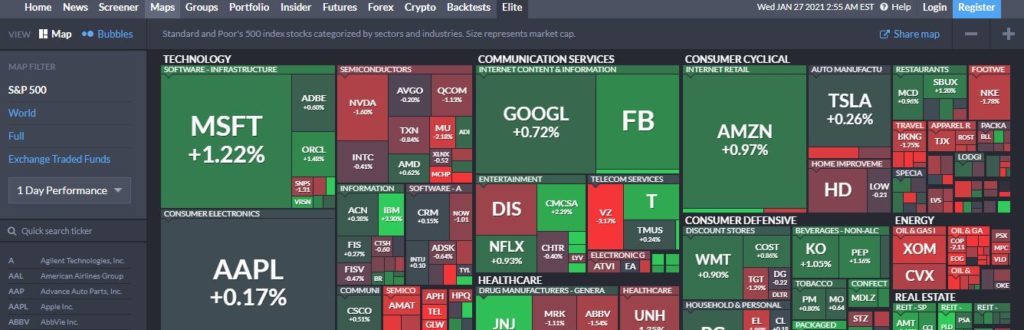
(Screenshot – https://finviz.com/map.ashx)
This is an extremely informative section that allows users to see stock price changes of individual companies, as well as industries and the stock market as a whole. Information is displayed in the form of a kind of table, each square of which designates a separate company. The size of the square indicates the level of company capitalization, and its color indicates the stock change in value for a particular period (by default, information is displayed for the previous day). The change in price is also given in percentage terms. Also, the stocks of all companies displayed are divided into several sectors in a table. Each segment shows an industry.
Groups

(Screenshot – https://finviz.com/groups.ashx)
This section shows price changes by groups. Thanks to the data provided, traders get an opportunity to assess the global market by viewing the dynamics of price development in individual economic sectors. The navigation in this section implies the use of key stock indexes, which significantly simplifies the technical analysis of price charts.
Portfolio
Access to this section is available after payment of the fee. The monthly payment is as few as $25. Traders can use this platform to simulate building their portfolios by buying and selling stocks at different prices depending on a particular period of time. Also, they can track their portfolios changes in value in real-time.
Insider Platform
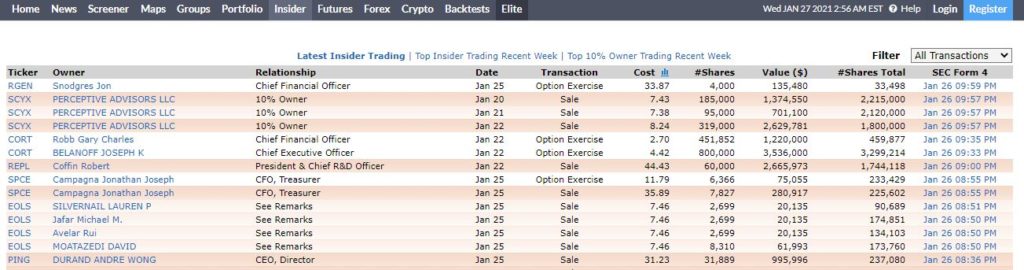
(Screenshot – https://finviz.com/insidertrading.ashx)
Users also need to register with Finviz to access to insider platform. This tab offers a glimpse into transactions made by insiders. This category of traders includes persons who have control over 10% of the company’s stock. As a rule, they are top-ranked employees of these organizations. It provides details like the type of transaction, date, cost, number of shares, and more. You can also see the top insider trading for the most recent week.
Futures
In this section, traders can view price charts and the dynamics of their changes related to the main futures.
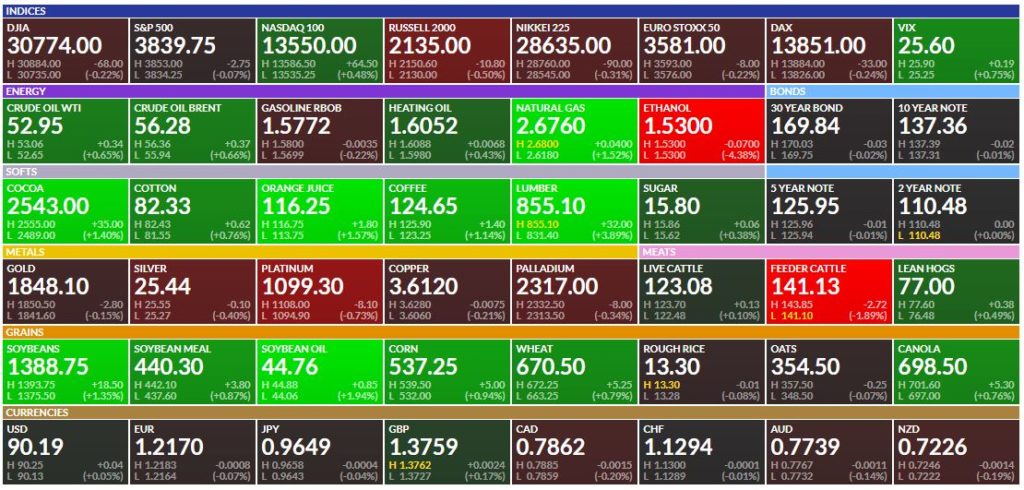
(Screenshot – https://finviz.com/futures.ashx)
Forex trading
This section allows traders to track fluctuations in the market of currencies.

(Screenshot – https://finviz.com/forex.ashx)
Backtests
Data of this section becomes available after payment of the fee. Here, it is possible to test personal trading strategies based on the price charts history. In addition, users can create additional filters for selecting stocks.
Cryptocurrency
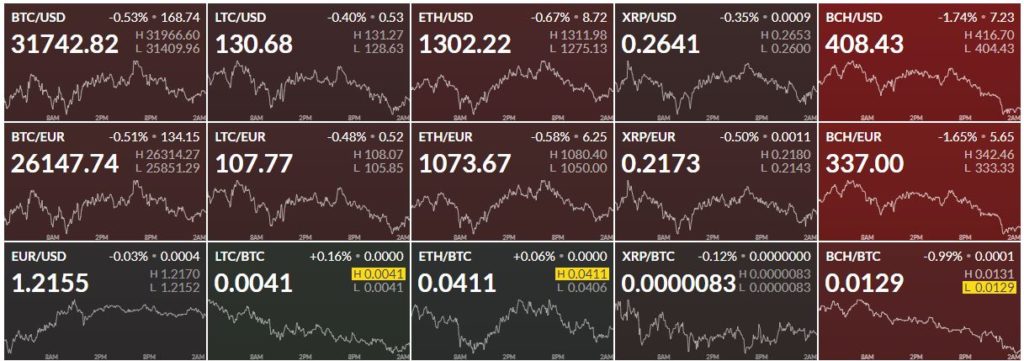
(Screenshot – https://finviz.com/crypto.ashx)
This section allows traders to track fluctuations in the market of cryptocurrency.
How to Pick Stocks with Finviz
The right choice of filtering tools depends on the strategy which is used by the trader. For the widespread approach to buying/selling securities based on the “buy and hold” principle, it is necessary to use filters, whereby it is possible to select cheaper stocks for which intensive growth is likely in the near future. It is also possible to select assets featured by a confident trend and low volatility. It is advisable to buy or sell assets in accordance with the current trend which is seen on the price chart.
How to use FINVIZ.com Stock Screener
Overview: FINVIZ.com Stock Screener
The Use of Additional Filters
Selecting the most suitable stocks for trading is better with the use of the following additional features of the Finviz service.
Price Multipliers
It is recommended to configure the filter with the following parameters:
- If the P/E (the price and profit ratio) value is less than 15, it indicates an adequate value of the security. If this value is more than 20, then this tells that the market value of the company exceeds the real value;
- The P/B (the ratio of price and book value of the company) value should be equal to or less than 2;
- The P/CF value (ratio of price and cash flow) has to be less than 20. This ratio indicates the availability of funds in the company’s turnover for either paying dividends to investors or further development of the organization.
Filters of Financial Ratios
The stocks intended for purchasing should be not only highly profitable but also reliable. For this, it is recommended to apply in the filters ratios of the company’s solvency, as well as its liquidity and profitability, namely:
- D/E Ratio (correlation of the borrowed money and the company’s own funds). This indicator should have a value below 0.5. “Companies that have no debt can’t go bankrupt,” Peter Lynch said.
- Quick Ratio (an indicator of urgent liquidity) should be higher than 1. It enables traders to filter out the most liquid assets;
- The Return on Equity (ROE) indicator should be more than 10%. This is one of the essential values, since if the return on invested capital is less than the return on low-risk assets, then stock trading becomes unprofitable in this case;
- Gross Margin and Operating Margin should be positive and have values higher than 0%. In addition, it is crucial to carefully study reports of companies whose stocks are already in the trader’s investment portfolio. Pay attention to the stability of the business model of the enterprise.
FINVIZ.com Stock Screener Pricing
Advanced filtering tools and the absence of delays in the provision of analytical materials are available to traders who have paid a monthly service fee of $40 or a one-time $300 per year. In total, the Finviz service offers three tariff plans: free plan (available without registration), registered users’ plan, and paid plan (Finviz Elite).
Users should determine for themselves the feasibility of using a paid version of the website. Advanced services are mostly necessary for day traders. If the stock trading is focused on the long term, then it will be quite enough to use free filtering tools.
Conclusion
The Finviz online service is a filtering platform with vast possibilities for selecting securities. When the user enters all the parameters for searching for assets, the result is presented in the form of a table, which is convenient for visual perception. The service shows data on stocks, and it possible to immediately see the dynamics of price fluctuations in the form of a graph, which is convenient for further technical analysis.
The user-friendly interface of the website is intuitive, and thanks to the full range of analytics provided here, traders can significantly save time on choosing the right assets for trading. Also, the 30-day money-back guarantee is an excellent option. So, FinViz remains one of the top free scanning services, and It is definitely worth using.