

Reading stock charts for day trading is a technique used by traders to analyze the past performance of a stock and make predictions about its future price movements. There are several key elements to understanding how to read stock charts, including:
Chart Patterns for Day Trading: Understanding the Different Types of Charts in Technical Analysis

There are several types of charts used in technical analysis, including candlestick charts, bar charts, and line charts. Each type of chart has its own strengths and weaknesses, so it’s important to choose the one that best suits your trading style and goals.
Identifying and Interpreting Candlestick Chart Patterns
Candlestick charts are a type of chart commonly used in technical analysis to display the price movements of a stock. They are made up of a series of “candlesticks” that represent the open, high, low, and close prices for a specific time period, usually one day.
Each candlestick is made up of a “real body” (the area between the open and close prices) and “shadows” (the thin lines above and below the real body) that represent the high and low prices.
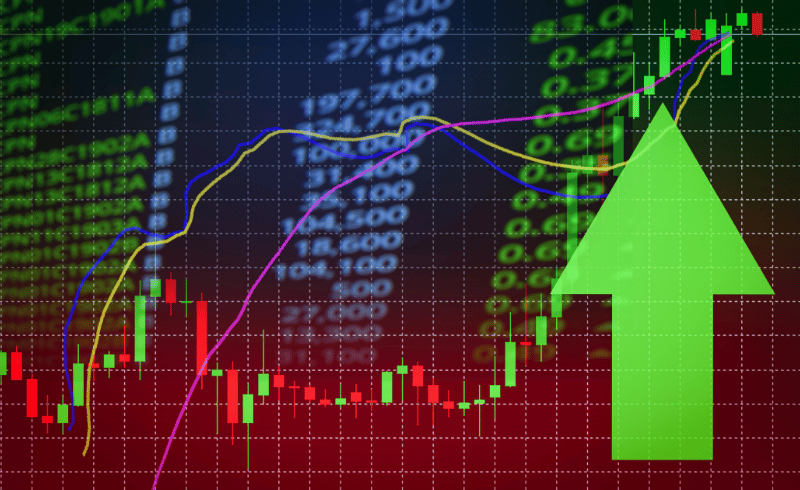
The color of the real body can indicate whether the stock closed higher or lower than the open price. A white or green real body indicates a stock closed higher than it opened, while a black or red real body indicates a stock closed lower than it opened.
The most important parameters to look at on candlestick charts are the open, high, low, and close prices, which provide a clear picture of the stock’s price movements during a specific time period. Additionally, traders often pay attention to patterns formed by the candlesticks, such as dojis, which can indicate a potential reversal in the stock’s trend.
Understanding Bar Chart Analysis
Bar charts: Bar charts are another type of chart commonly used in technical analysis to display the price movements of a stock. They are similar to candlestick charts in that they represent the open, high, low, and close prices for a specific time period, but the information is presented in a slightly different format. Each bar on a bar chart represents the high and low prices for a specific time period, and the left and right sides of the bar indicate the open and close prices, respectively. Like candlestick charts, the color of the bar can indicate whether the stock closed higher or lower than it opened.
The most important parameters to look at on bar charts are the open, high, low, and close prices, which provide a clear picture of the stock’s price movements during a specific time period. Additionally, traders often pay attention to patterns formed by the bars, such as head and shoulders, which can indicate a potential reversal in the stock’s trend.
Utilizing Line Charts in Technical Analysis
Line charts are a simple type of chart used in technical analysis to display the price movements of a stock. They consist of a series of data points connected by lines, with the closing price represented by a dot. Line charts are useful for identifying trends and patterns in the stock’s price over time, but they do not provide as much information about the stock’s price movements as candlestick or bar charts.
The most important parameter to look at on line charts is the closing price, which can indicate the overall direction of the stock’s trend. Additionally, traders often pay attention to key levels of support and resistance formed by the lines, which can indicate potential buying or selling opportunities.
TOP: candlestick charts are the most popular among traders as they provide the most detailed picture of a stock’s price movements, bar charts are similar but offer a slightly different format, and line charts are the simplest and used to identify trends and patterns in the stock’s price over time. Traders should choose the one that best suits their trading style and goals.
Understanding Trends in Stock Prices
Identifying trends in stock prices is a crucial aspect of technical analysis for day traders. By recognizing patterns in the stock’s price movements, traders can make informed decisions about when to buy or sell a stock. In this section, we will discuss the three main types of trends: uptrends, downtrends, and ranges and explain how to identify and interpret them.
Identifying Uptrends and Opportunities for Buying
An uptrend is a pattern of higher highs and higher lows in a stock’s price. This indicates that the stock is generally moving upward and that buyers are in control. To identify an uptrend, traders look for a series of higher highs and higher lows on the chart. The most important parameters to look at are the stock’s high and low prices, which can indicate the overall direction of the trend. Traders also pay attention to key levels of resistance, which can indicate potential selling opportunities.
For example, if a stock is trading at $10 on day 1, $12 on day 2 and $13 on day 3, this would indicate an uptrend because the stock’s price is moving upward and making higher highs and higher lows. In this example, the highest high is 13, the lowest low is 10, this means that the stock is trending upward.
Traders look for this type of pattern to identify an uptrend and make a decision to buy the stock, as they believe the stock will continue to rise in value.
It’s important to note that an uptrend is not always a guarantee of a stock’s price will continue to rise, and traders should always consider other factors such as the stock’s fundamentals, market conditions and volume of trading before making a trade.
Spotting Downtrends and Exit Points
A range is a pattern of horizontal movement in a stock’s price. This indicates that the stock is moving sideways and that there is a balance between buyers and sellers. To identify a range, traders look for a series of similar high and low prices on the chart. The most important parameters to look at are the stock’s high and low prices, which can indicate the overall direction of the trend. Traders also pay attention to key levels of support and resistance, which can indicate potential buying or selling opportunities.
For example, if a stock is trading at $20 on day 1, $18 on day 2, and $17 on day 3, this would indicate a downtrend because the stock’s price is moving downward and making lower lows and lower highs. In this example, the highest high is 20, the lowest low is 17, this means that the stock is trending downward.
Traders look for this type of pattern to identify a downtrend and make a decision to sell the stock, as they believe the stock will continue to decrease in value.
It’s important to note that a downtrend is not always a guarantee of a stock’s price will continue to fall, and traders should always consider other factors such as the stock’s fundamentals, market conditions and volume of trading before making a trade.
Understanding and Trading in a Range-bound Market
A range is a pattern of horizontal movement in a stock’s price. This indicates that the stock is moving sideways and that there is a balance between buyers and sellers. To identify a range, traders look for a series of similar high and low prices on the chart. The most important parameters to look at are the stock’s high and low prices, which can indicate the overall direction of the trend. Traders also pay attention to key levels of support and resistance, which can indicate potential buying or selling opportunities.
For example, if a stock is trading at $30 on day 1, $30 on day 2, and $30 on day 3, this would indicate a range because the stock’s price is not making any significant high or low movements, it’s moving horizontally.
In this example, the highest high and the lowest low are the same which is 30, this means that the stock is in a range.
Traders often use this type of pattern to identify a range, they can make a decision to hold the stock, as they believe the stock will continue to move in the same direction, or they can wait for a breakout to occur and make a decision based on the breakout direction.
It’s important to note that a range is not always a guarantee of a stock’s price will continue to move horizontally, and traders should always consider other factors such as the stock’s fundamentals, market conditions and volume of trading before making a trade.
TOP:, uptrends indicate a bullish market, downtrends indicate a bearish market and ranges indicate a balance between buyers and sellers. Traders should choose the one that best suits their trading style and goals, and always consider other factors such as the current market conditions, the stock’s fundamentals and volume of trading before making a trade.
Using Chart Analysis to Make Trading Decisions

Understanding Resistance and Support Lines
Resistance and support lines are key concepts in technical analysis that traders use to identify potential buying or selling opportunities in a stock. These lines represent the highest and lowest prices at which a stock has consistently faced buying or selling pressure, respectively. By understanding and identifying these levels on a stock chart, traders can make informed decisions about when to enter or exit a trade. In this section, we will explain what resistance and support lines are, demonstrate their basic concepts, and discuss the most important parameters to look at when identifying these lines.
- A resistance line represents the highest price at which a stock has consistently faced selling pressure. This means that, as the stock’s price approaches this level, there is likely to be increased selling activity, which can cause the stock’s price to stall or even decrease. When identifying resistance lines, traders look for patterns of consistently lower highs on the stock chart.
- A support line represents the lowest price at which a stock has consistently faced buying pressure. This means that, as the stock’s price approaches this level, there is likely to be increased buying activity, which can cause the stock’s price to stabilize or even increase. When identifying support lines, traders look for patterns of consistently higher lows on the stock chart.
- When identifying resistance and support lines, the most important parameter to look at is the stock’s price, which can indicate the overall direction of the trend. Traders also pay attention to volume of trading, which can indicate the level of buying or selling pressure, and chart patterns such as head and shoulders, which can indicate a potential reversal in the stock’s trend.
The most important parameter to look at when identifying resistance and support lines is the stock’s price, which can indicate the overall direction of the trend. Traders also pay attention to volume of trading, which can indicate the level of buying or selling pressure.
Using Historical Price Behavior to Predict Future Movements
Examining past price behavior is a key aspect of technical analysis that allows traders to predict future price movements of a stock. By studying patterns in a stock’s historical price data, traders can identify trends, ranges, and other patterns that can indicate potential buying or selling opportunities. In this section, we will explain what examining past price behavior to predict future behavior is, provide examples with numbers, and discuss the most important parameters to look at when using this technique.
Examining past price behavior to predict future behavior is the process of studying a stock’s historical price data to identify patterns and trends that can indicate where the stock may be headed in the future. This can be done by studying the stock’s historical high and low prices, as well as its trading volume. By identifying patterns in this data, traders can make predictions about the stock’s future price movements.
For example, if a stock’s historical price data shows a pattern of consistently higher lows, it may indicate that the stock is in an uptrend and that the price is likely to continue rising. On the other hand, if a stock’s historical price data shows a pattern of consistently lower highs, it may indicate that the stock is in a downtrend and that the price is likely to continue falling.
When examining past price behavior to predict future behavior, the most important parameters to look at are the stock’s historical high and low prices, which can indicate the overall direction of the trend. Traders also pay attention to volume of trading, which can indicate the level of buying or selling pressure, and chart patterns such as head and shoulders, which can indicate a potential reversal in the stock’s trend.
Identifying Key Price Levels for Trading

Determining at what prices certain actions may occur is an important aspect of technical analysis for day traders. By identifying key price levels, traders can predict at what prices they should enter or exit a trade, and make better trading decisions. These key price levels can be identified by studying resistance and support lines, chart patterns and other indicators.
In this section, we will explain how to determine at what prices certain actions may occur, and discuss the most important parameters to look at when using this technique.
Determining at what prices certain actions may occur involves identifying key price levels on a stock chart and looking for patterns in the stock’s price. For example, if a stock consistently faces selling pressure at a certain price, that price may be considered a key resistance level. If the stock breaks through that resistance level, it may indicate a potential upward trend, and traders may consider buying the stock. On the other hand, if a stock consistently faces buying pressure at a certain price, that price may be considered a key support level. If the stock falls below that support level, it may indicate a potential downward trend, and traders may consider selling the stock.
When determining at what prices certain actions may occur, the most important parameters to look at are the stock’s historical high and low prices, which can indicate the overall direction of the trend. Traders also pay attention to volume of trading, which can indicate the level of buying or selling pressure, and chart patterns such as head and shoulders, which can indicate a potential reversal in the stock’s trend.
Conclusion
Charts play a crucial role in technical analysis for day trading. By understanding key concepts such as resistance and support lines, examining past price behavior to predict future behavior, and determining at what prices certain actions may occur, traders can make informed decisions about when to buy or sell a stock. Charts provide a wealth of information that can help traders make better trading decisions and increase their chances of success.
We welcome any comments or questions that you may have, and we look forward to hearing from you.

